How we performed
FINANCIAL PERFORMANCE – SELECTED HIGHLIGHTS
| Six months ended 31 Dec 2013 $m |
Six months ended 31 Dec 2014 $m |
|
|---|---|---|
| Gross written premium | 4,786 | 5,603 |
| Net earned premium | 4,320 | 5,154 |
| Net claims expense | (2,508) | (3,481) |
| Underwriting profit | 671 | 266 |
| Investment income on technical reserves | 87 | 427 |
| Insurance profit | 758 | 693 |
| Investment income on shareholders’ funds | 233 | 137 |
| Net profit attributable to holders of ordinary shares |
642 | 579 |
FINANCIAL POSITION
| As at 30 June 2014 $m |
As at 31 Dec 2014 $m |
|
|---|---|---|
| Cash and investments | 16,396 | 16,090 |
| Other assets | 9,721 | 10,525 |
| Goodwill and intangibles | 3,540 | 3,595 |
| Total assets | 29,657 | 30,210 |
| Claims provisions and unearned premium | 18,193 | 18,936 |
| Borrowings and other liabilities | 4,670 | 4,467 |
| Total liabilities | 22,863 | 23,403 |
| Net assets | 6,794 | 6,807 |
| Equity attributable to IAG shareholders | 6,568 | 6,583 |
| Non-controlling interests | 226 | 224 |
| Total equity | 6,794 | 6,807 |
Key Figures

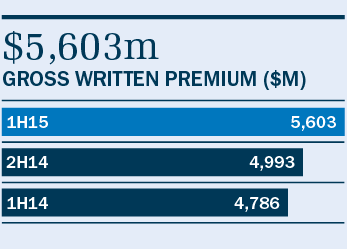
Increased by 17.1% to $5.6 billion, largely reflecting the first-time inclusion of the former Wesfarmers business.

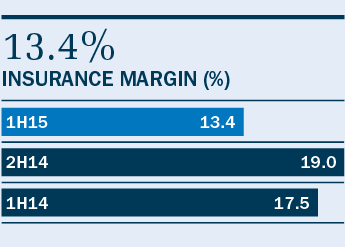
The Group’s reported insurance margin of 13.4% was affected by net natural peril claim costs of $421 million, $71 million higher than our allowance and including $165 million for the Brisbane storm in November 2014; and lower prior period reserve releases of $92 million, equivalent to 1.8% of net earned premium (NEP), down from 4.3% in the first half of the 2014 financial year.

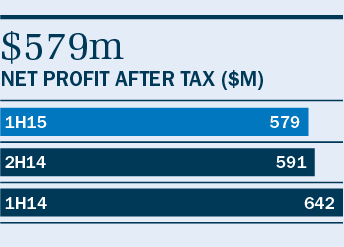
Compared to the first half of last financial year, net profit after tax decreased by nearly 10% to $579 million.

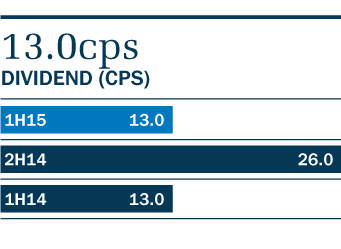
Consistent with the last interim dividend of 13.0 cents per share (cps) and equal to a payout ratio of 46.6% of cash earnings. The Group’s policy is to pay out 50-70% of cash earnings in any given year. The fully franked dividend will be paid on 1 April 2015, to shareholders registered at 4 March 2015. The Dividend Reinvestment Plan will operate for the interim dividend.

